LLM Observability with Langfuse: A Complete Guide
Discover how Langfuse redefines LLM observability with end-to-end traceability for cost, quality, and compliance.

As more organizations integrate Large Language Models (LLMs) into their applications, the need for robust observability is becoming increasingly evident. Recently, I’ve been experimenting with different approaches to track, analyze, and optimize LLM interactions in production environments. Today, I want to share my experience implementing Langfuse—an open-source observability platform tailored to LLM applications.
The Growing Need for LLM Observability
Working with LLMs introduces unique challenges that traditional monitoring solutions often fail to address. Unlike deterministic systems—where identical inputs consistently produce the same outputs—LLMs exhibit variability, making debugging and performance analysis significantly more complex.
Here are a few real-world scenarios that illustrate why specialized LLM observability is essential:
- Cost Management: How can you identify expensive or inefficient prompts that drive up API costs?
- Quality Assurance: What systematic methods ensure hallucinations or problematic responses are detected early?
- Traceability: How do you follow the path of a user request through multiple LLM calls and processing steps?
- Compliance: How do you maintain reliable audit trails for industries with strict regulatory requirements?
Introducing Langfuse: Purpose-Built Observability for LLMs
Langfuse is an open-source observability solution built specifically to address these challenges. While general-purpose tools might capture high-level metrics, Langfuse digs deeper into LLM-specific metrics—enabling detailed trace collection, scoring, and analytics tailored to conversational AI workflows.
I recently implemented Langfuse in a project that leverages:
- OpenAI’s GPT models (for advanced language analysis)
- Financial data from the Federal Reserve Economic Data (FRED) API (for domain-specific insights)
This combination allowed me to demonstrate Langfuse’s capabilities in monitoring complex workflows that rely on multiple data sources and models.
Implementation Overview
Key Principles
- Secure Credential Management: All API keys and secrets are stored and retrieved from AWS Parameter Store.
- Comprehensive Tracing: Every workflow step—prompt, response, metadata—is captured for end-to-end visibility.
- Detailed Input/Output Tracking: Prompts and responses are recorded, enabling robust debugging and analytics.
- Exception Handling: Errors are logged and flagged for immediate attention and root-cause analysis.
Below, I’ll walk through the code patterns and architectural decisions that showcase how Langfuse can be integrated into a production LLM workflow.
Secure Credential Management
In a production environment, security and compliance are paramount. By storing credentials in AWS Parameter Store, we avoid hardcoding secrets directly into the application code. For automated rotation and fine-grained access control, use AWS Secrets Manager.

Helper functions to securely retrieve Langfuse credentials from environment variables or AWS Systems Manager Parameter Store, with error logging and optional decryption support.
Why this matters:
- No hardcoded secrets: Reduces the risk of credentials being exposed in version control.
- Encrypted storage: Parameter values can be encrypted using AWS KMS.
- Failover logic: Environment variables are checked first, then AWS Parameter Store.
Setting Up Langfuse for Tracing
Once credentials are retrieved, we initialize Langfuse and start a trace. Traces act as top-level containers for all subsequent events, enabling you to track a complete workflow from initiation to completion.

Initializes a Langfuse trace for tracking a FRED-based financial analysis workflow, with secure credential loading and trace metadata setup.
Key takeaways:
- Single source of truth: Each trace captures the end-to-end journey of an LLM request.
- Enriched metadata: Contextual details (environment, version, etc.) are stored for downstream analysis in the Langfuse UI.
Detailed Event Logging
With a trace established, we can log individual events. Each event includes a unique event ID, timestamp, stage, status, and optional input/output data.

Generates ISO timestamps and logs structured events to Langfuse with stage-specific metadata, status, and optional input/output data.
Why this is valuable:
- Unique event IDs: Quickly correlate logs to specific actions.
- Status codes: Distinguish successes from failures.
- Input/Output capture: Facilitates debugging by tying each prompt to its corresponding response.
Real-World Example: Financial Analysis Workflow
The St. Louis Federal Reserve Economic Data (FRED) API , offered by the Federal Reserve Bank of St. Louis, provides free programmatic access to over 825,000 U.S. and international economic time series from 114 data sources.
The example below retrieves FRED economic data, builds a contextualized prompt, queries a large language model (LLM), and logs each step using Langfuse.

Fetches recent FRED data, constructs a financial analysis prompt, queries an LLM, and logs each step with detailed metadata and latency tracking.
What’s happening here:
- Data Retrieval: We pull time-series data from FRED.
- Prompt Construction: The LLM receives relevant context and historical trends.
- Observability: Each stage—data retrieval, prompt creation, and LLM analysis—is captured in Langfuse.
- Latency measurement: Enables fine-grained performance tuning.
- End-to-end correlation: Connects the original prompt with the final response in one trace.
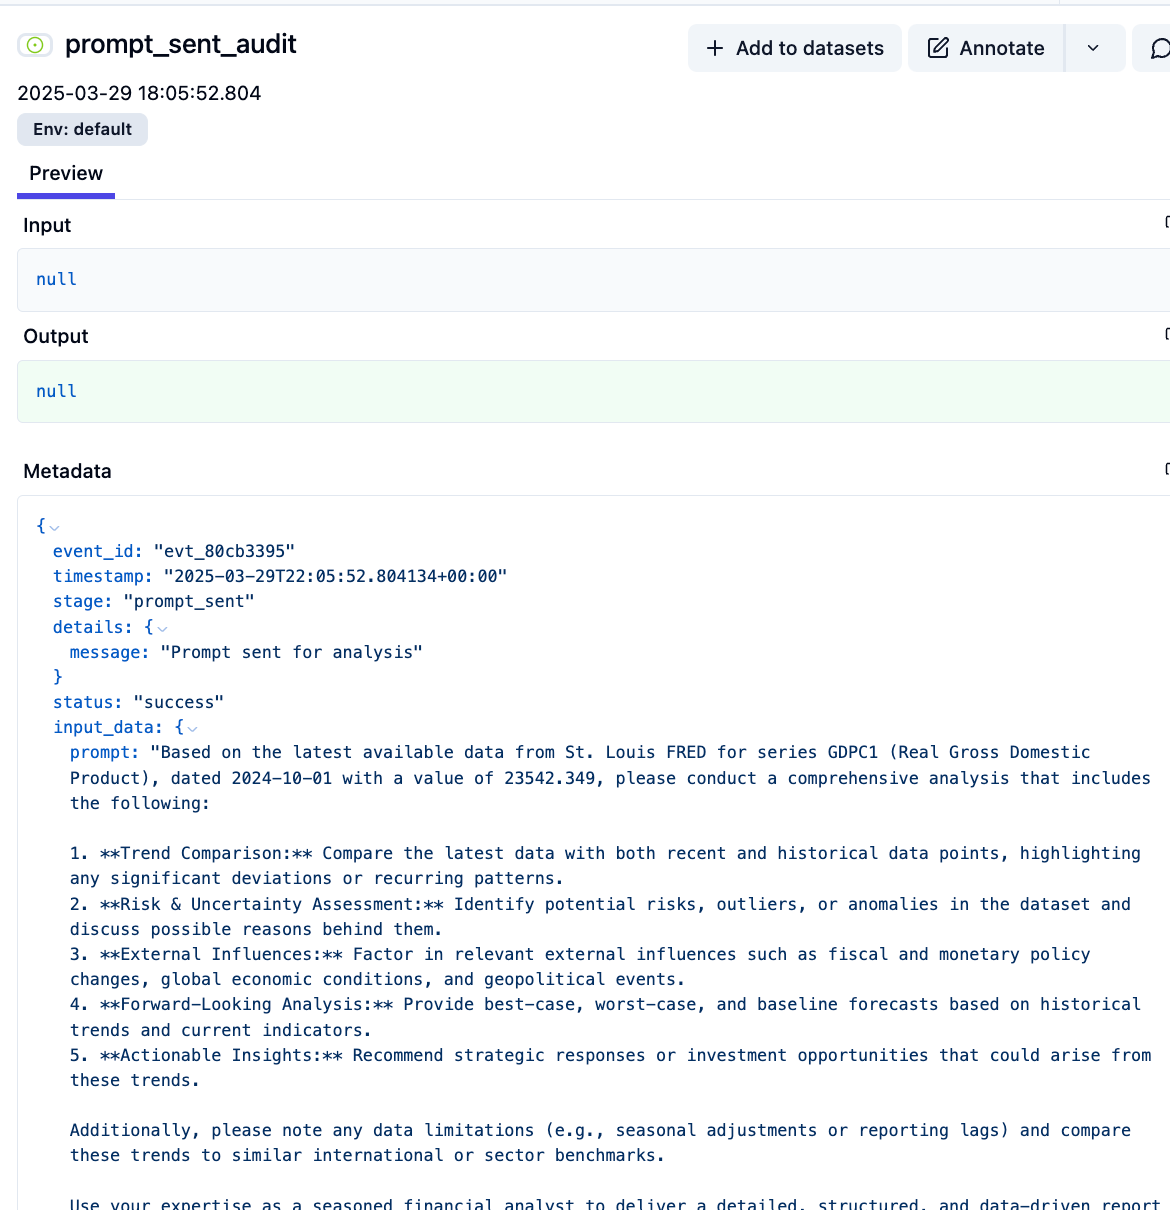
In the figure below, the Langfuse event logs a successfully sent prompt for analysis, using recent FRED data (GDP series GDPC1) as context. It includes metadata like event ID, timestamp, stage (prompt_sent), and the full structured input prompt designed to guide a large language model through a five-part financial analysis covering trends, risks, external factors, forecasts, and strategic insights.

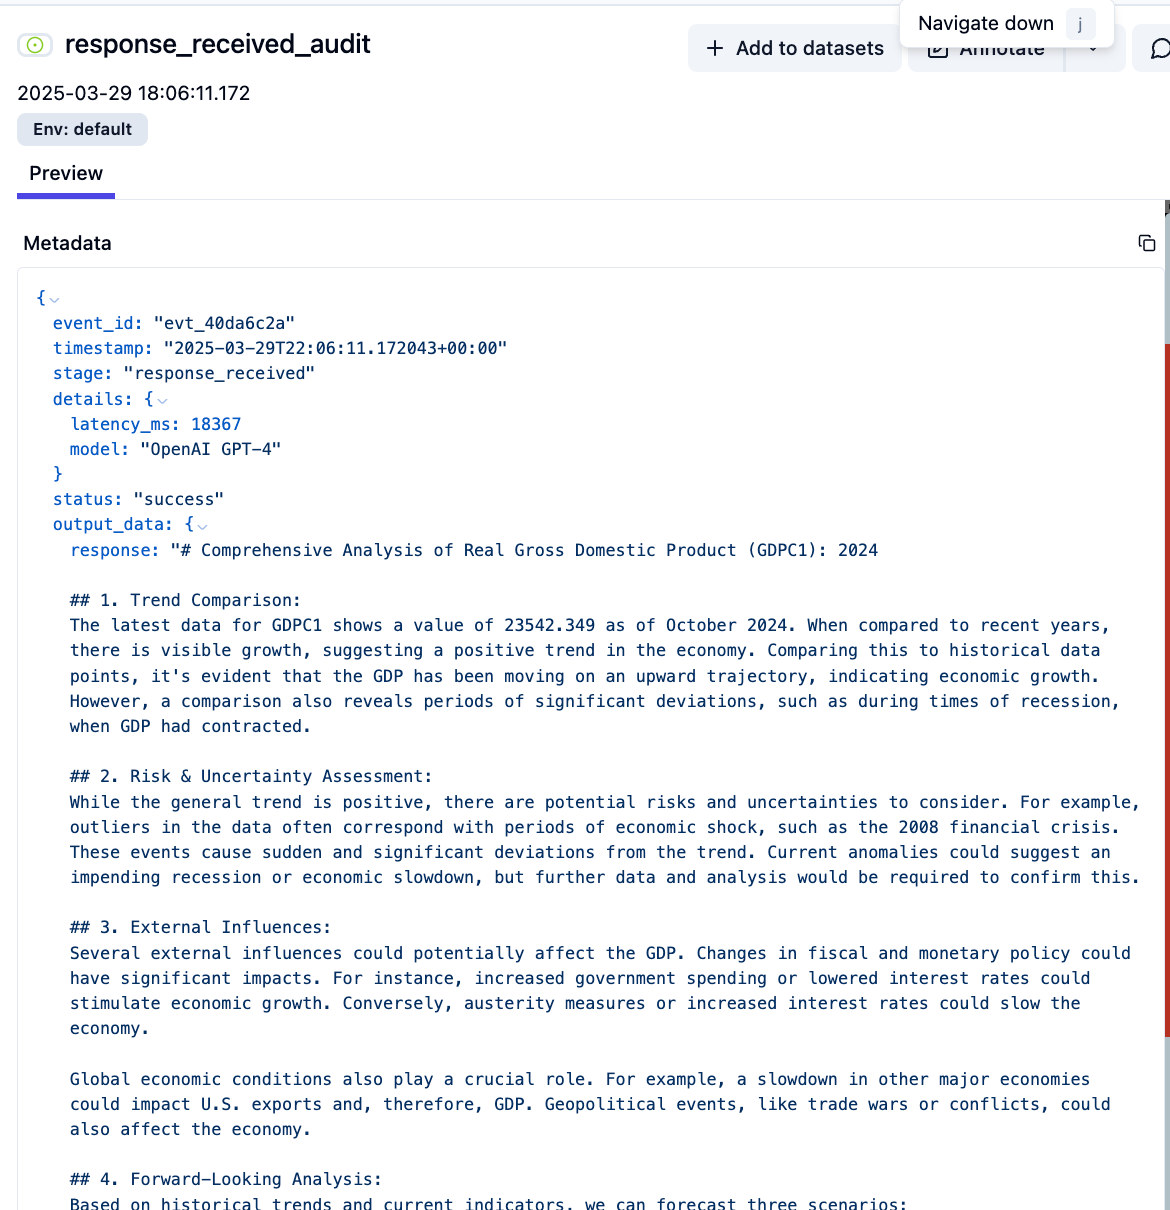
In the figure below, the Langfuse event captures a successful response from OpenAI GPT-4, logged under the response_received stage. It includes metadata such as event ID, timestamp, model, and a latency of 18,367 ms. The output contains a detailed, structured financial analysis of the FRED GDP series (GDPC1), covering trend comparison, risk assessment, external influences, forecasting, and strategic insights, as prompted in the previous step.

Benefits and Use Cases
1. Production Debugging
Langfuse’s detailed tracing reduces debugging time significantly. When unexpected results appear, it’s easy to pinpoint whether the root cause lies in the FRED data, prompt construction, or model response.
2. Cost Optimization
Trace analysis often uncovers hidden inefficiencies. In my own setup, refining prompt content and adjusting request frequency revealed opportunities to reduce OpenAI API costs.
3. Quality Monitoring
With Langfuse’s scoring capabilities, you can implement systematic quality checks. Custom metrics can flag questionable responses—like hallucinations or inappropriate content—prompting further investigation.
4. Compliance Requirements
For organizations in regulated industries, verifiable audit trails aren't optional—they're mandatory. Langfuse provides end-to-end traceability by logging every interaction and capturing both input and output at scale. When combined with digital attestations, this enables cryptographically secure, tamper-evident records that can help satisfy regulatory benchmarks and strengthen trust across internal and external stakeholders.
Alternatives and Complementary Tools
- LangSmith by LangChain: Ideal if your project extensively uses LangChain. It provides a more integrated experience but can be less flexible in mixed-tech stacks.
- Weights & Biases (W&B): Best known for experiment tracking. While it offers strong model-centric features, it may require extra configuration for production LLM observability.
- Arize AI: Offers powerful ML monitoring with a strong visualization layer. However, it’s more generalized, so specialized LLM features may be less mature than Langfuse.
- Custom ELK Stack: Extending Elasticsearch, Logstash, and Kibana can yield a bespoke solution if you already rely heavily on the ELK stack. The drawback: significantly more engineering overhead compared to out-of-the-box LLM solutions.
Implementation Recommendations
- Define Your Trace Strategy First: Clarify what events, metadata, and metrics matter most for your use case.
- Capture Rich Context: Include environment, version, and workflow data in your traces for more robust filtering and analysis.
- Secure Everything: Leverage AWS Parameter Store or other secure secret management systems for credentials.
- Balance Detail & Volume: Logging everything may incur high storage costs. Be strategic about which data is truly necessary for analysis.
- Automate Error Handling: Automatically flag error events so your team can act quickly.
Looking Forward
LLM observability is still evolving. As we weave more complex LLM-driven workflows into our business processes, tools like Langfuse become invaluable for reliability, cost control, and continuous improvement. In future iterations, I am considering the following ideas:
- Automate Quality Checks: Build evaluation pipelines that systematically score LLM responses.
- Real-Time Alerts: Integrate Langfuse with alerting systems like PagerDuty or AWS SNS.
- Cost Optimization Strategies: Use usage patterns to auto-adjust prompt length or model selection.
Adopting an LLM observability tool like Langfuse has fundamentally reshaped how we design, deploy, and maintain AI-driven applications. By bringing visibility to previously opaque LLM interactions, we’re empowered to build applications that are more reliable, cost-effective, and high-quality.
Whether you’re just getting started with LLMs or looking to harden your existing deployment, investing in dedicated observability should be one of your priorities. Tools like Langfuse provide a clear foundation for responsible, production-scale LLM management.


